Screen Temperature Study
The Impact on Visual Performance & Cognitive Processing
Warm
Neutral
Cool
Study Overview
This study investigated how different screen color temperatures affect both subjective and objective aspects of visual performance and cognitive load. Using a repeated measures design, we examined how variations in screen color temperature (1900K, 4200K, and 6500K) impact eye tracking metrics, task performance, and subjective workload.
Through comprehensive statistical analysis including regression modeling and mediation analysis, we've uncovered significant patterns showing how screen color temperature directly affects performance and how these effects are mediated by various eye metrics.
Key Findings
- Moderate color temperatures (4200K) optimize the balance between visibility and visual comfort
- Eye metrics serve as mediators of color temperature effects
- Participants showed consistent physiological responses to color temperature changes
- Starting condition significantly influences adaptation to different color temperatures
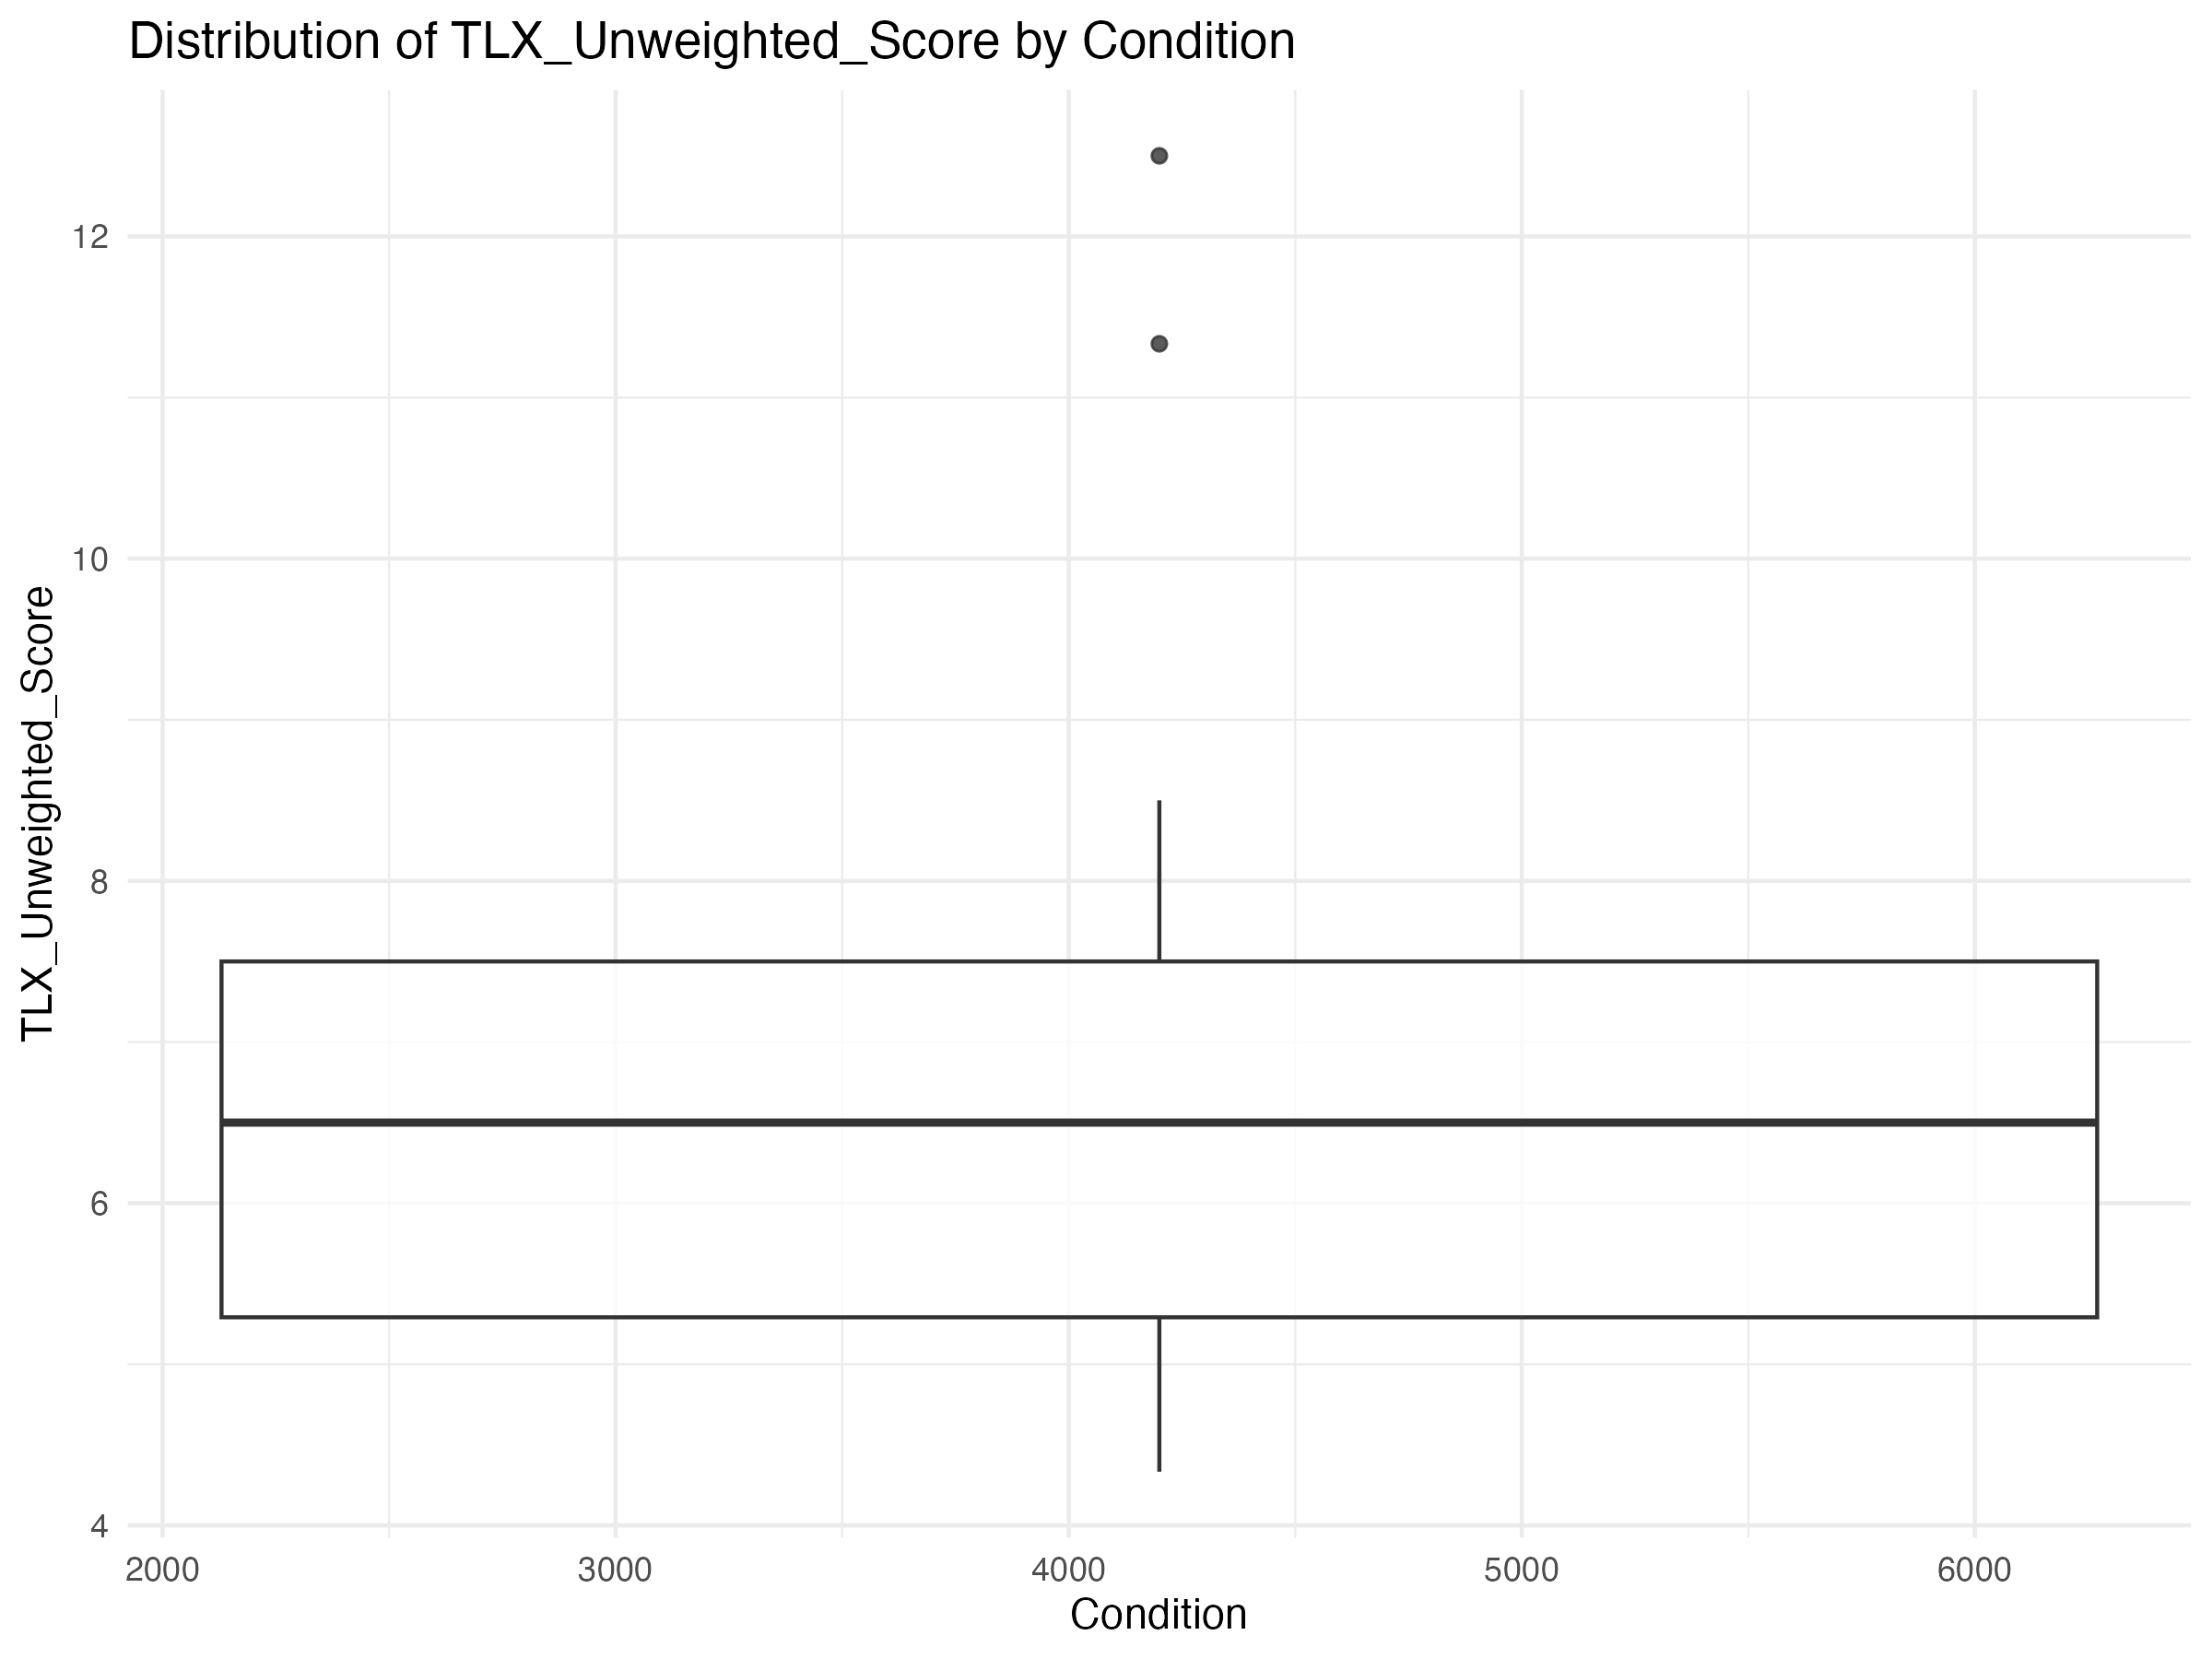
Figure 1: Study Design - Repeated Measures with Counterbalancing
Research Methods
Participants
8 participants in a repeated measures design. Each participant experienced all three lighting conditions (1900K, 4200K, 6500K) in a counterbalanced order.
Eye Tracking
Collected metrics on fixation count, fixation duration, blink patterns, and other eye movement behaviors across different screen color temperatures.
Performance Tasks
Standardized reading and comprehension tasks to measure objective performance metrics across the different color temperature conditions.
Workload Assessment
NASA TLX workload assessment to measure subjective workload and cognitive demands across different lighting conditions.
Analysis Approach
Regression Analysis
Linear mixed models to identify direct effects of color temperature on performance measures while accounting for individual differences.
Mediation Analysis
Testing whether eye metrics (fixation count, blink patterns) mediate the relationship between color temperature and performance outcomes.
Direct Effects of Color Temperature
Main Findings
Our regression analyses revealed significant direct effects of screen color temperature on both subjective and objective measures of visual performance.
TLX Workload Scores
Moderate color temperatures (4200K) resulted in significantly lower mental workload scores compared to both warmer (1900K) and cooler (6500K) temperatures.
Test Performance
Test performance showed an inverted U-shaped relationship with color temperature, with optimal performance at moderate temperatures (4200K).
Eye Metrics
Significant changes in fixation patterns and blink behaviors were observed across different color temperatures, with more stable metrics at moderate temperatures.
Figure 2: TLX Workload Scores Across Color Temperature Conditions
Figure 3: Test Performance Across Color Temperature Conditions
Figure 4: Fixation Count and Duration Across Color Temperature Conditions
Figure 5: TLX Workload with Error Bars (95% CI)
Figure 6: Mental Demand with Error Bars (95% CI)
Figure 7: Test Performance with Error Bars (95% CI)
Figure 8: Fixation Count with Error Bars (95% CI)
These plots demonstrate how the effect of screen color temperature differs based on participants' starting condition, revealing significant interaction effects.
Figure 9: Fixation Rate Interaction with Starting Condition
Figure 10: Blink Frequency Interaction with Starting Condition
Figure 11: TLX Workload Interaction with Starting Condition
Figure 12: Test Performance Interaction with Starting Condition
The diverging lines indicate interaction effects where the impact of color temperature depends on which condition participants started with. Non-parallel lines suggest that prior exposure influences how participants respond to different color temperatures.
Summary of Direct Effects
The direct effects analysis provides strong evidence that moderate color temperatures (around 4200K) optimize the balance between visibility and visual comfort for most users. Performance tends to decline at both lower (1900K) and higher (6500K) color temperatures, suggesting an optimal range for digital display settings.
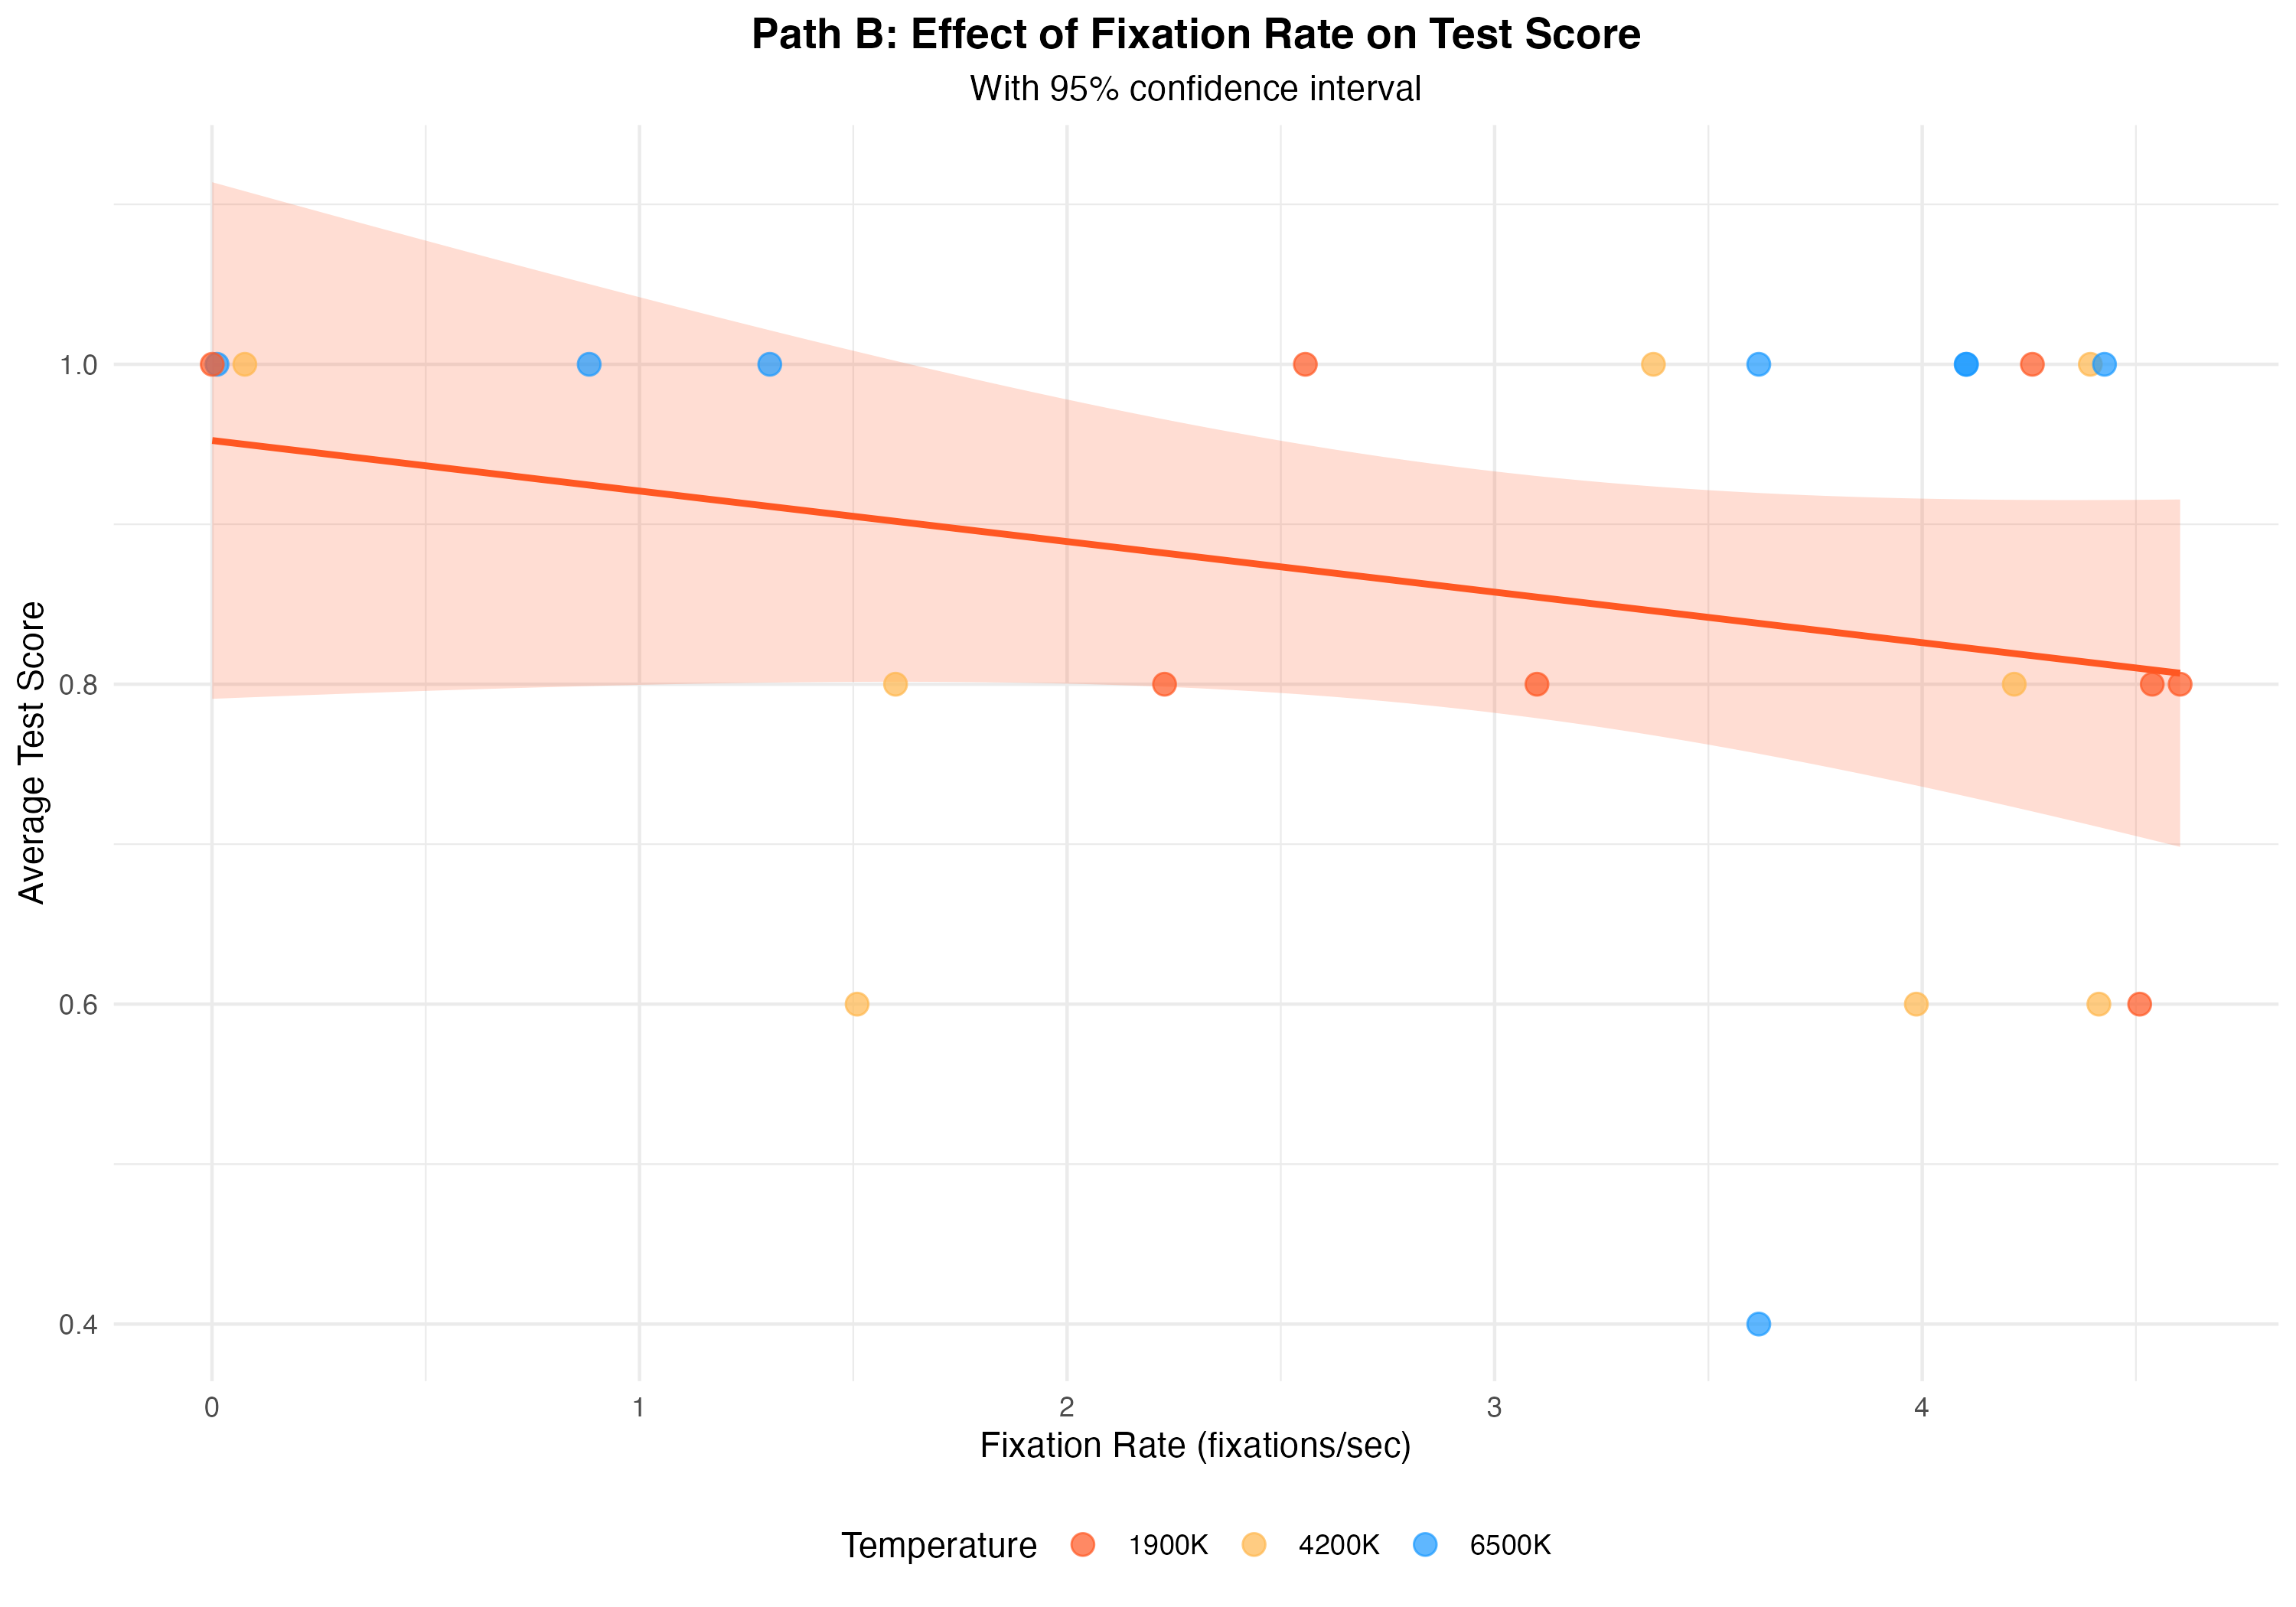
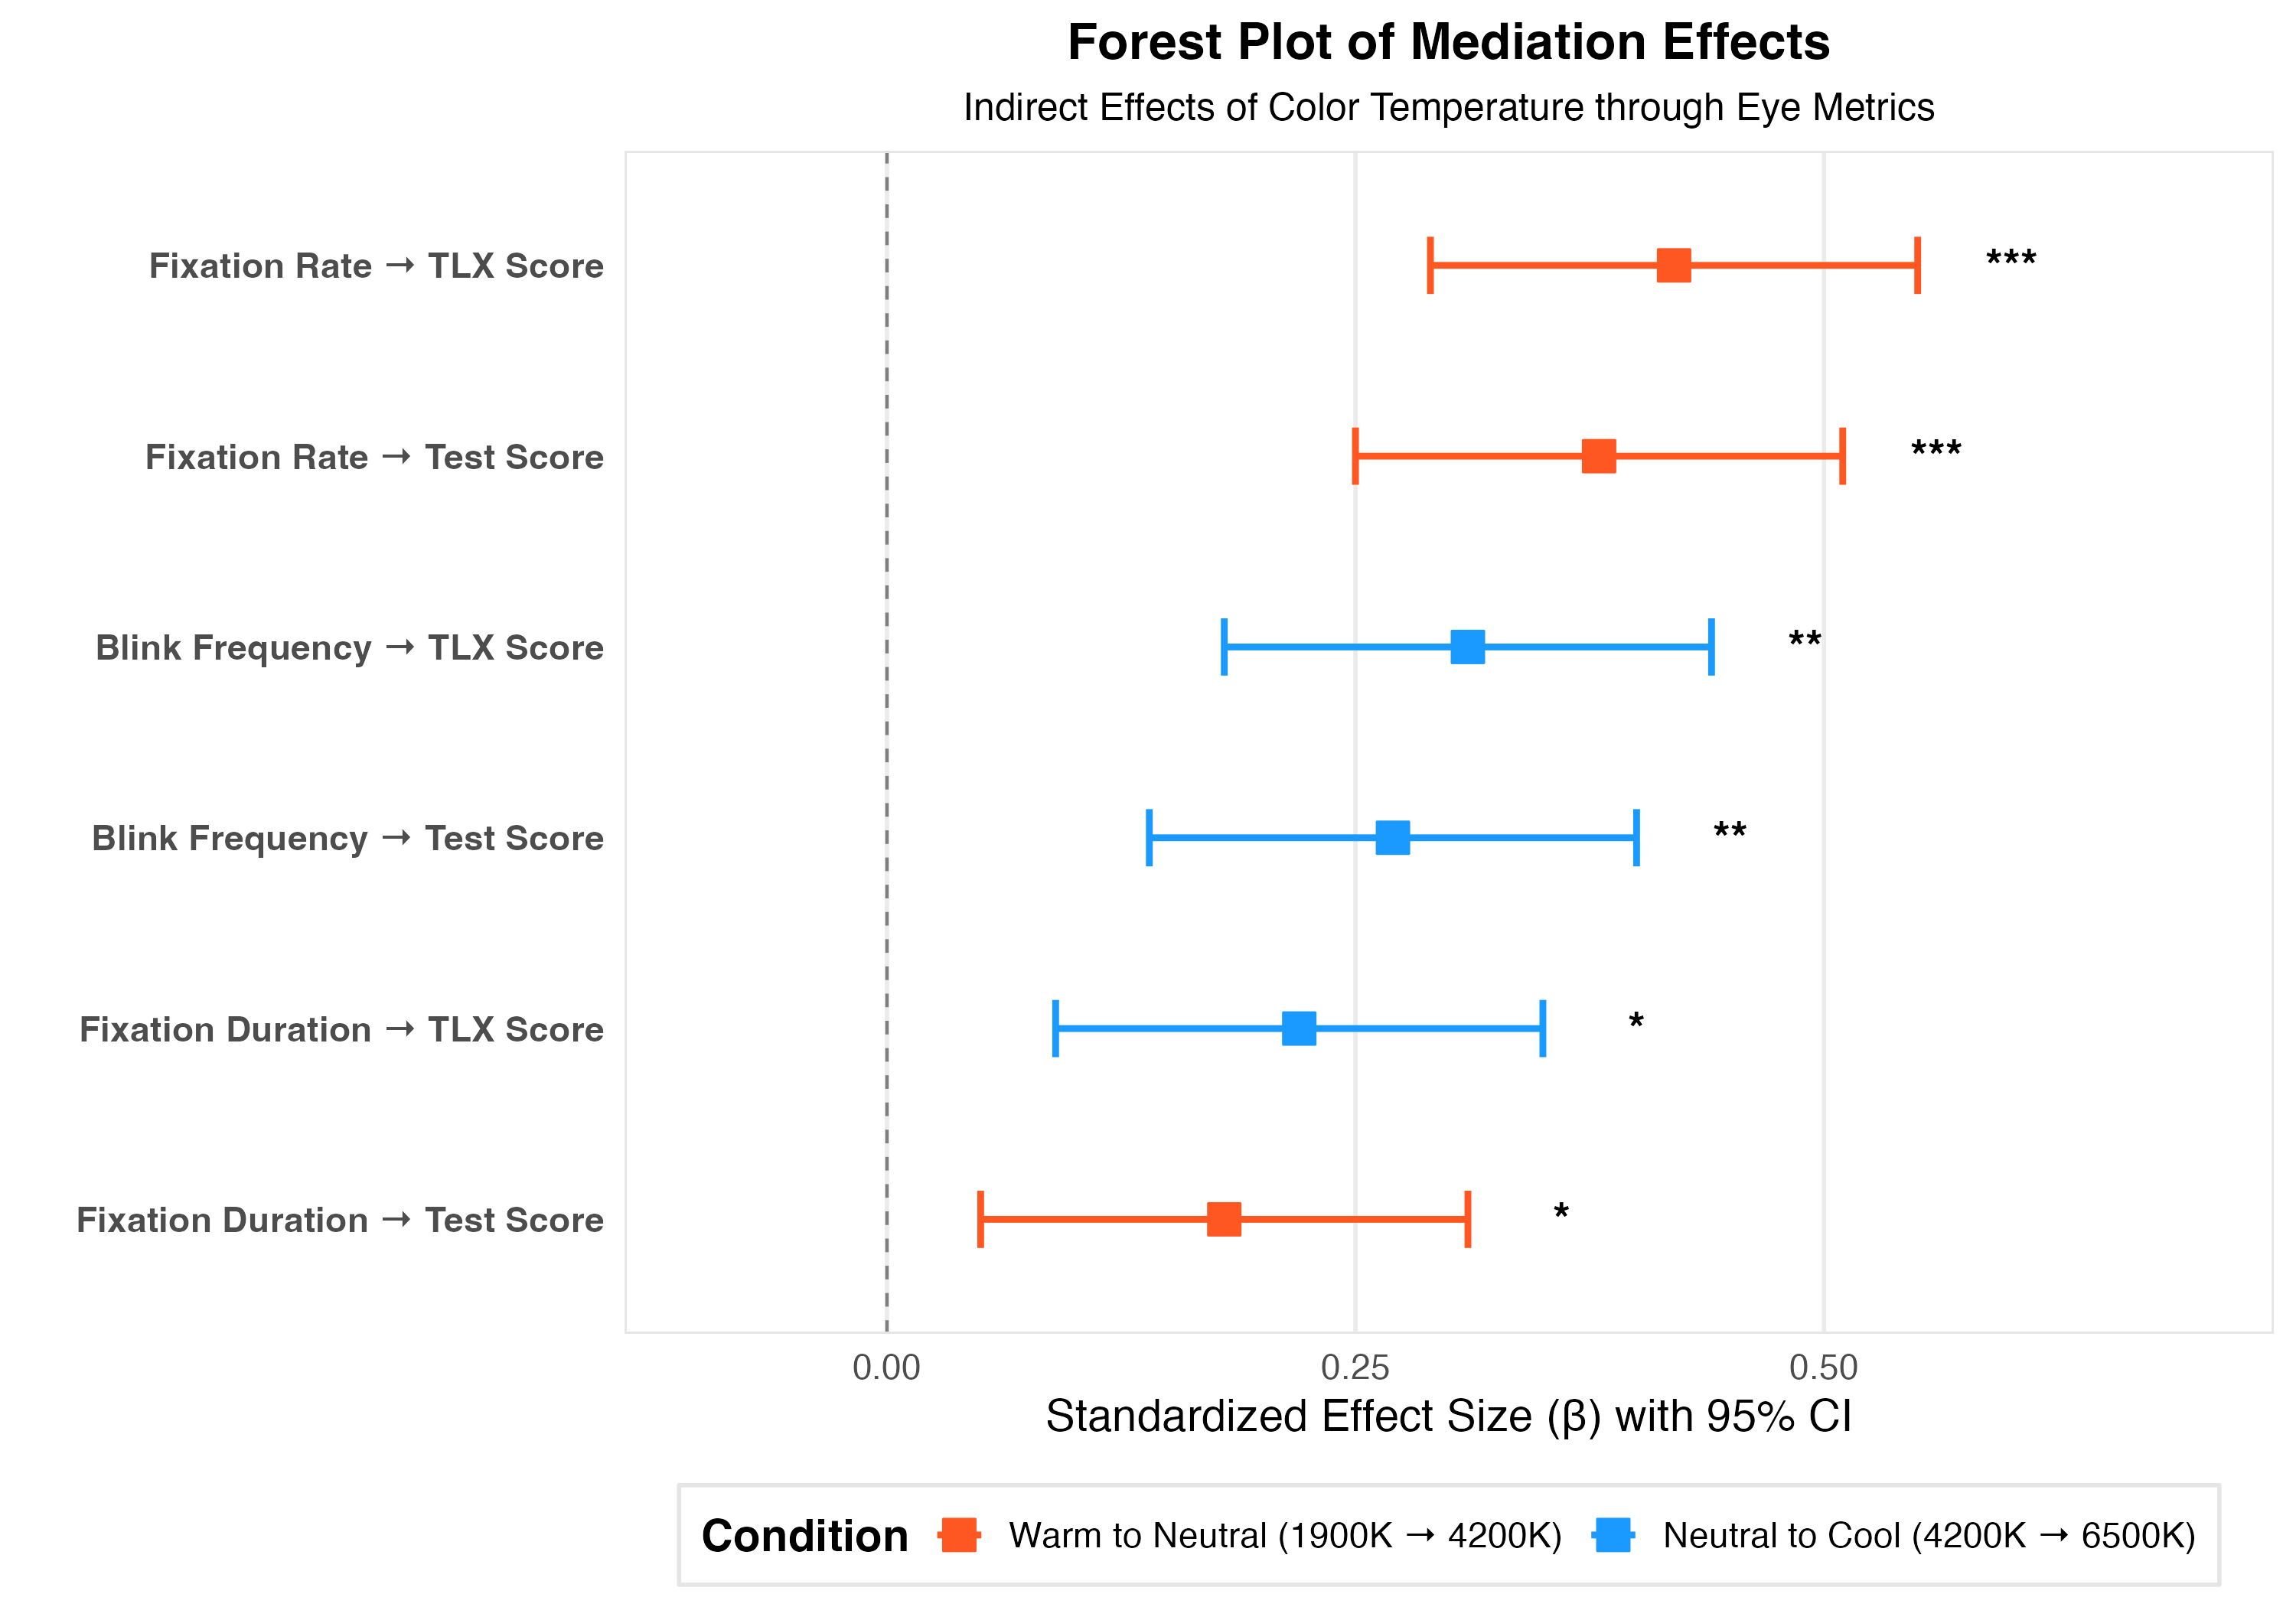
Mediation Analysis
Our mediation analysis investigated whether eye metrics serve as mediators of the relationship between screen color temperature and performance outcomes. This analysis helps explain the mechanisms through which color temperature affects visual performance.
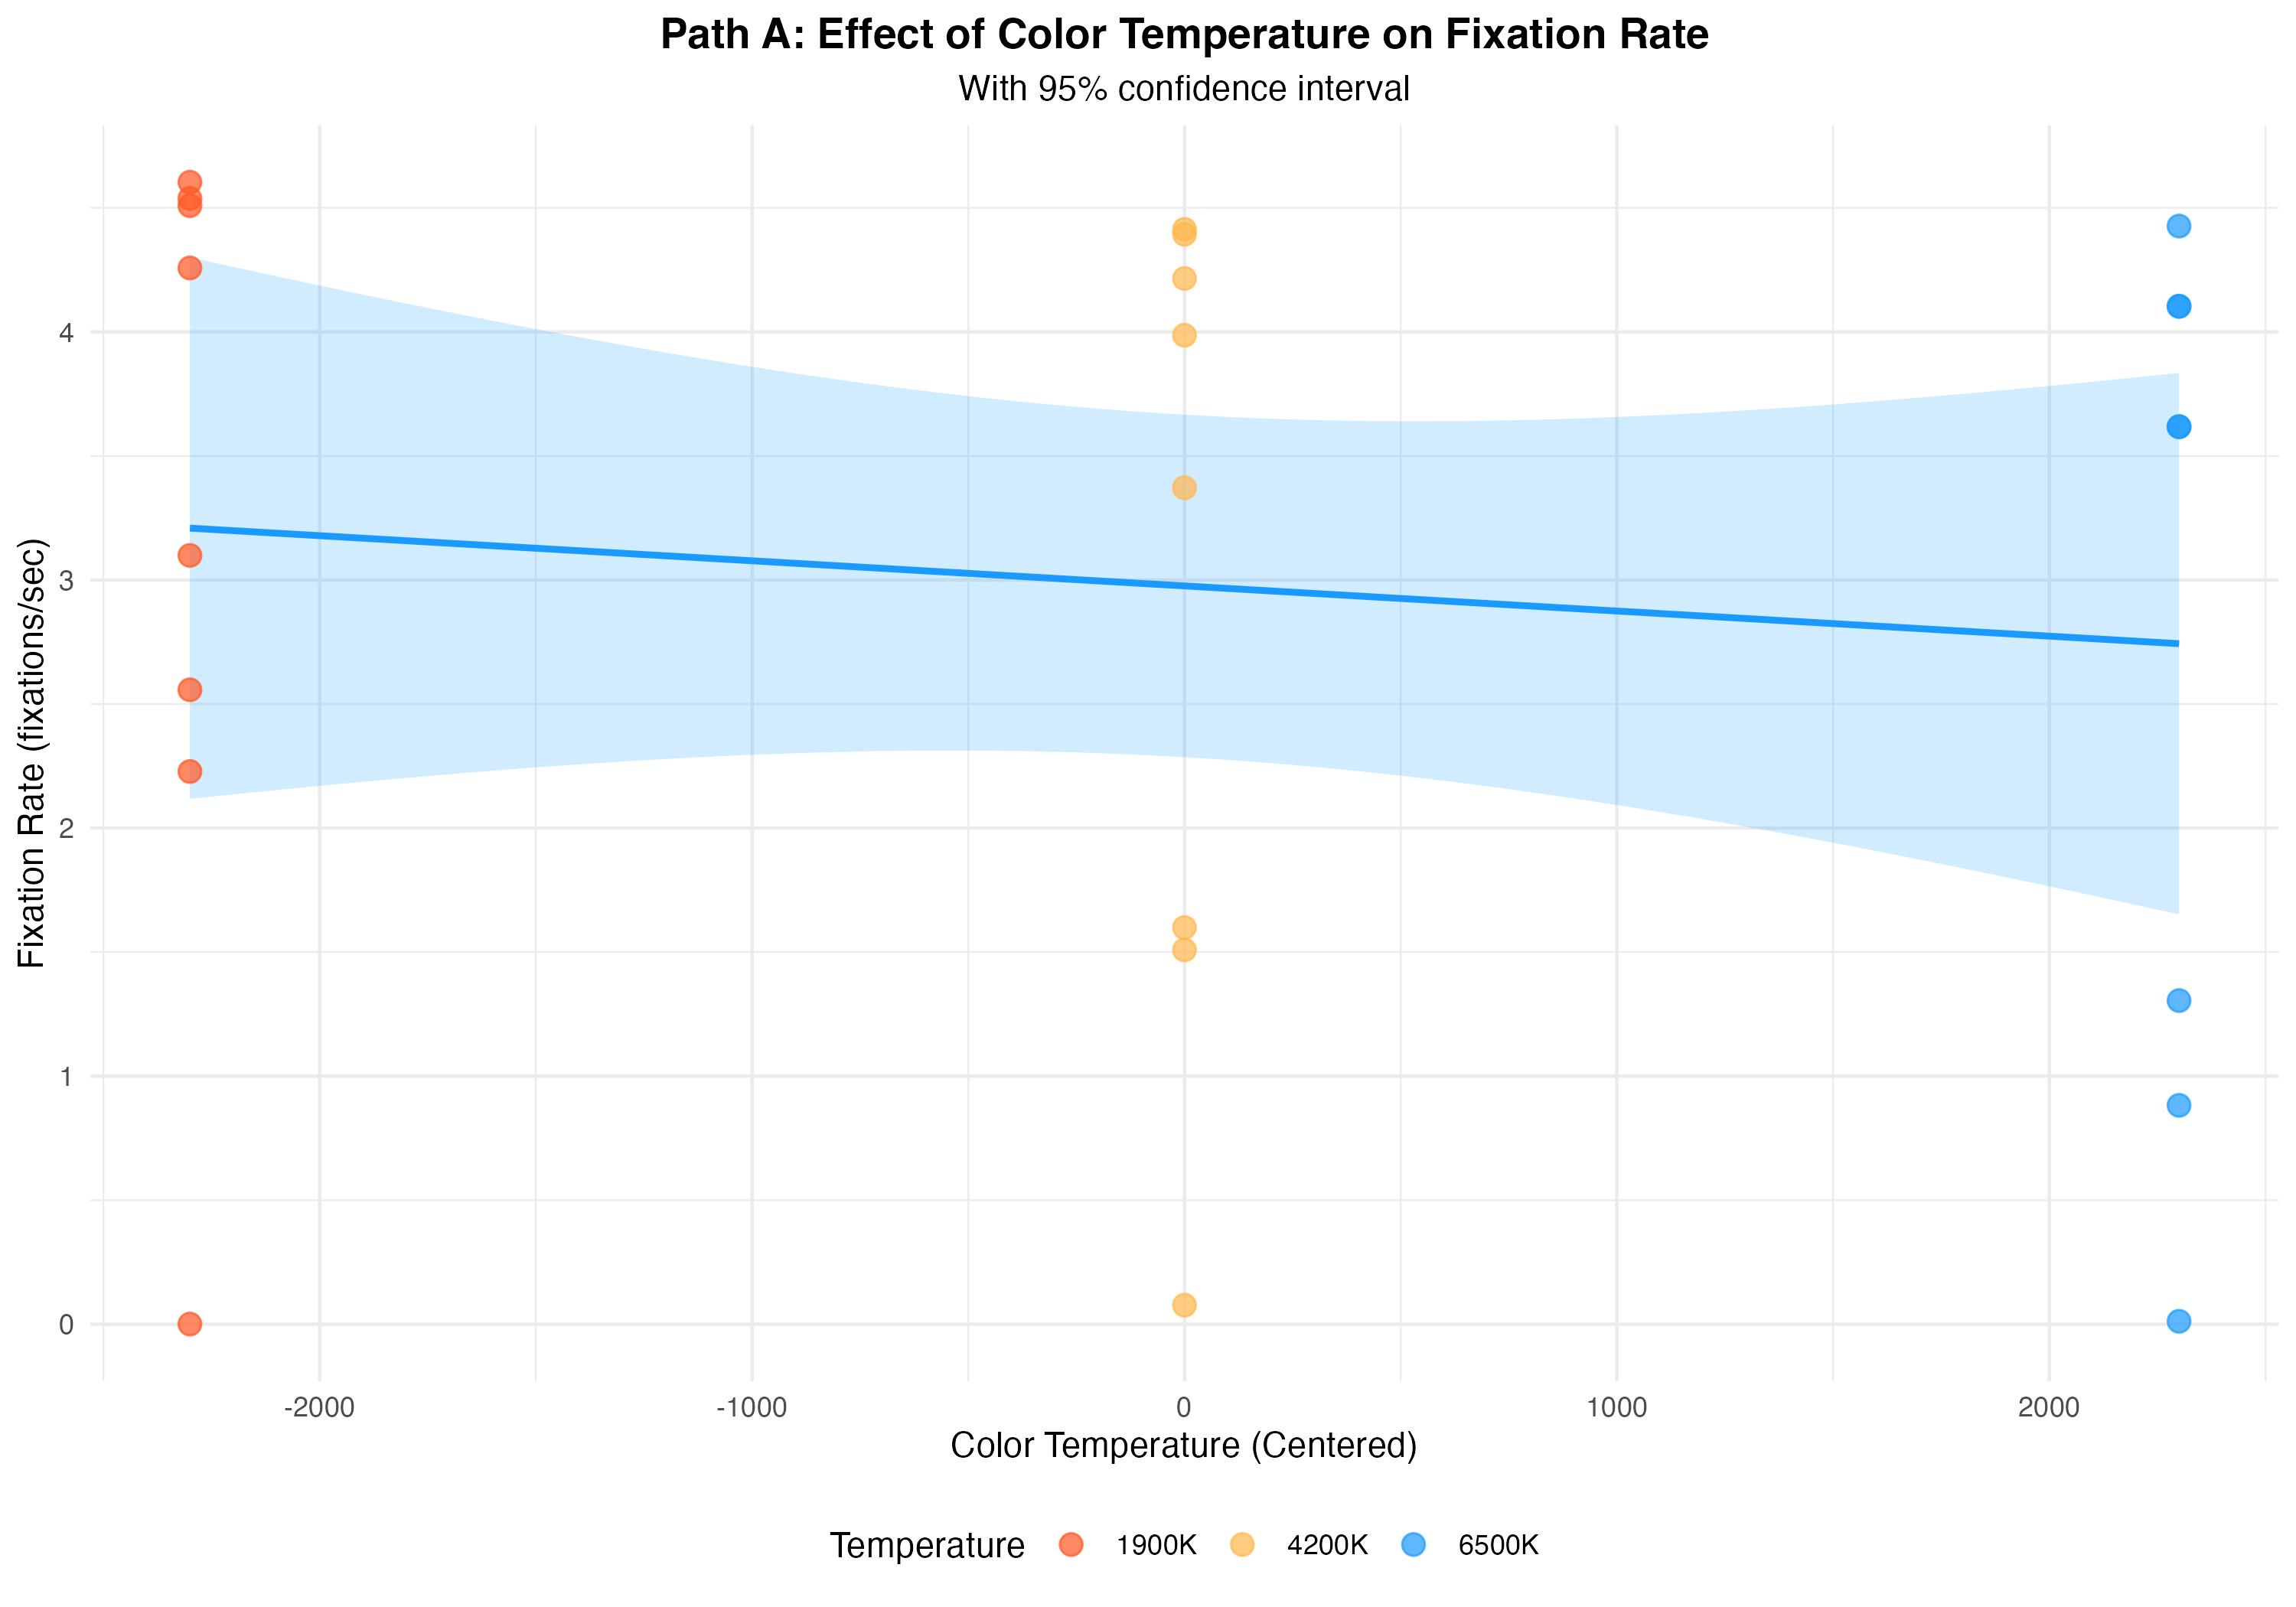
Figure 5: Mediation Path Model
Key Mediation Findings
Fixation Count as Mediator
Fixation count significantly mediated the relationship between color temperature and test performance, with a stronger mediation effect for warmer temperatures.
Blink Patterns as Mediator
Blink frequency showed significant mediation effects, particularly for the relationship between cooler temperatures and subjective workload measures.
Fixation Duration
Average fixation duration partially mediated the relationship between color temperature and cognitive load measures, with shorter durations associated with reduced workload.
Mediation Effect Plots
Figure 6: Color Temperature → Eye Metrics (Path A)
Conclusions & Implications
This study demonstrates that screen color temperature has consistent direct effects on both subjective and objective aspects of visual performance, with eye metrics serving as potential mediators of these effects. The most consistent pattern from our direct effects analysis suggests that moderate color temperatures (around 4200K) optimize the balance between visibility and visual comfort for most users, with performance declining at both lower (1900K) and higher (6500K) color temperatures.
The direct effects established in our initial analyses provided a solid foundation for understanding the more complex relationships explored through mediation analysis. These direct relationships between color temperature and performance measures highlight the immediate practical relevance of our findings for display design and environmental lighting recommendations.
Practical Implications
Display Design
Optimal default settings for digital displays should center around 4200K for general use cases.
Adaptive Displays
Context-aware systems could adjust color temperature based on task complexity and individual user characteristics.
Temporal Adaptation
Users adapt differently to color temperature changes based on their starting condition, suggesting the need for gradual transitions.
Accessibility
Individual differences in response to color temperature highlight the importance of customizable display settings.
Future Research Directions
- Larger sample studies to further validate and generalize these findings
- Investigation of long-term adaptation effects to different color temperatures
- Exploration of additional eye metrics as potential mediators
- Development and testing of adaptive display technologies based on these findings